Asian totals shrink a full game into fine-grained decisions. Instead of “over 2.5” or “under 2.5,” you get quarter and half lines—1.75, 2.0, 2.25 and so on—that let you split risk, lock in partial returns, or surrender smaller losses. This article walks through how those lines behave, how to estimate value with basic models, and practical approaches to staking and in-play adjustments drawn from experience and common market behavior.
How Asian total lines work in practice
Asian totals are often described as split bets: a 2.25 total is the equivalent of half your stake on 2.0 and half on 2.5. The market treats quarter lines as two close but distinct bets, which changes outcomes at the margins. That nuance matters when a match finishes on a number that sits between the two components.
Using these lines, a bettor can turn a binary win/lose decision into one with “half wins” or “half losses.” For example, backing Under 2.25 and seeing a 2-goal game gives a half-win because the 2.0 portion returns at full, while the 2.5 portion is a win as well. Conversely, an exact 3-goal game might convert your stake into a clear loss.
Quick reference: outcomes for common totals
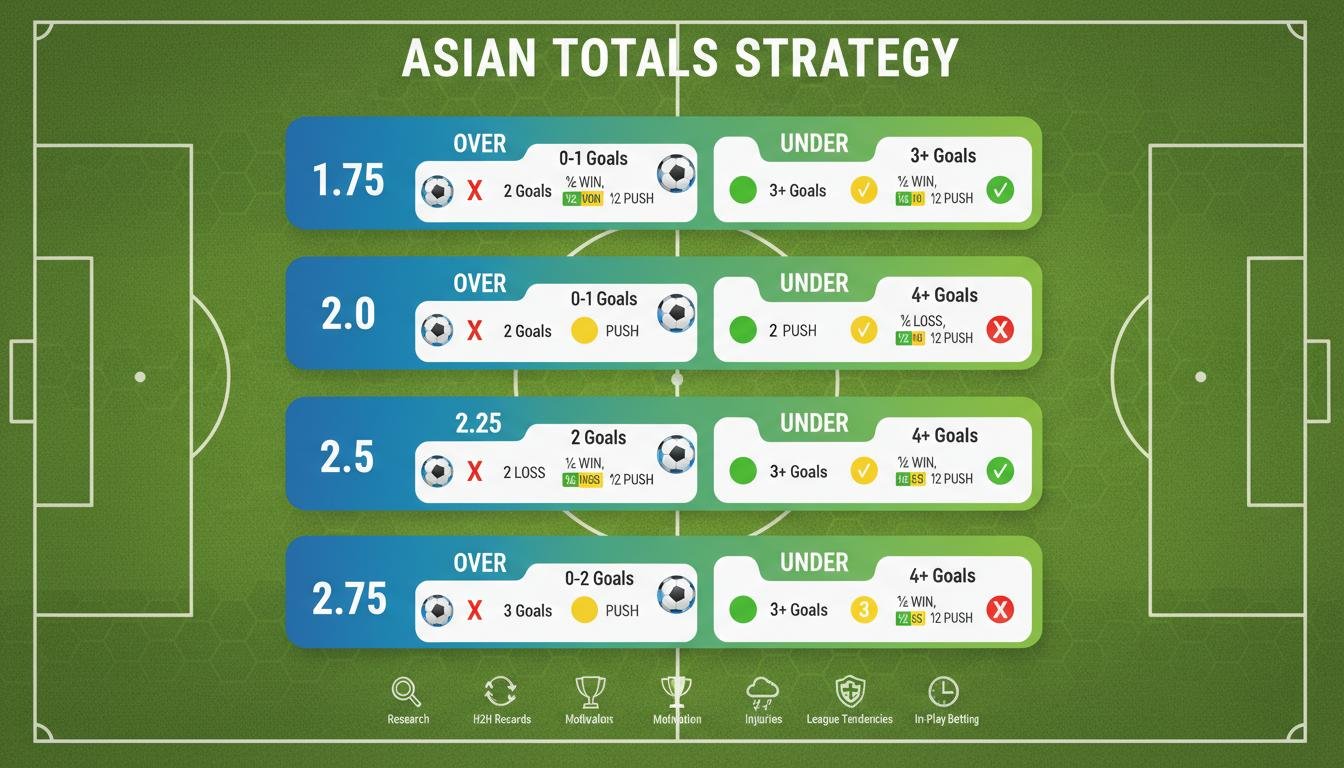
Below is a compact table mapping typical game totals to the practical outcomes for each of the listed Asian lines. Use this when you’re calculating expected returns and when you need to explain results to a novice.
| Line | Split | Example: 0–1 goals | Example: 2 goals | Example: 3+ goals |
|---|---|---|---|---|
| 1.75 | 1.5 + 2.0 | Win | Half loss (1.5 loses, 2.0 push) | Loss |
| 2.0 | Single line | Win | Push (stake returned) | Loss |
| 2.25 | 2.0 + 2.5 | Win | Half win (2.0 push, 2.5 win) | Loss |
| 2.5 | Single line | Win | Win | Loss |
| 2.75 | 2.5 + 3.0 | Win | Half loss (2.5 win, 3.0 push) | Loss |
Translating probabilities into edges
Before putting money down, estimate the market probability that total goals will exceed or stay below a given threshold. The simplest practical model uses Poisson or xG distributions to estimate the probability of each goal total. Expected goals (xG) tend to be a better predictor than historical averages because they incorporate shot quality.
As an example from my own tracking: I used a basic xG model across a small sample of second-division matches and found the market often overstated the chance of low-scoring draws in bad weather. When I compared the implied market probability for Under 2.5 against my xG-based projection, I found small edges I could exploit by backing Under 2.25 or Under 2.5 depending on price.
How to interpret half wins and pushes in expected value
When a line is split, compute expected value by weighting the two component outcomes. Suppose you estimate a 55% chance of Under 2.5 and a 52% chance of Under 2.0; backing Under 2.25 treats your stake as 50% on each number, so the implied probability for a winning return becomes the average of the two. This arithmetic is straightforward but essential; don’t ignore the half-win mechanics when calculating whether a bet is positive EV.
Always account for commission and limits. If you are using an exchange that charges commission on net winnings, your break-even probabilities shift slightly. Likewise, small perceived edges can evaporate under market limits and minimum stake rules, so scale your strategy to the liquidity you can access.
Practical strategies for each line
Choose your line based on confidence and appetite for volatility. Use 2.0 when you want simplicity: it gives a push on 2 goals and is useful when you expect a coin-flip around that total. Opt for 2.25 when you want a softer downside or to capture value when you believe the market underestimates a low-scoring outcome.
For example, if your model gives Under 2.25 a 57% chance but the market prices Under 2.25 at a 52% implied probability, that’s a clear place to stake. Conversely, if you’re marginal on whether the game will be tight, 1.75 or 2.75 can be used as conservative plays that buffer a one-goal swing into a smaller loss rather than a full one.
In-play adjustments and hedging
Asian totals shine in-play. A 0-0 game at half can be hedged aggressively by laying the full-time market to secure a profit if play suggests a scoreless second half. Alternatively, if your pre-match model favored Under 2.25 but the first-half statistics show a barrage of shots and weak defending, you can take the other side live at a price that locks a smaller loss or a half-push.
One practical trick I use: when I back Under 2.25 pre-match and the first goal arrives early, I watch the odds for an immediate live lay on the same line. Often the market overreacts to early events, and a fast lay can turn a potential full loss into a half loss or even a small profit.
Bankroll management and staking plans
Small edges require disciplined staking. Treat Asian totals the same way you treat any value bet: fix a staking percentage of your bankroll rather than an absolute dollar amount. For edges in the low-single-digit percentage range, consider 1–2% of bankroll per bet to allow variance to play out without ruin.
Use unit sizing that reflects the clarity of your edge. If your model strongly favors Under 2.25, increase the stake within your plan; for marginal situations, reduce it. Keep a simple ledger tracking lines taken, market prices, and the eventual outcomes—over months, patterns emerge that raw memory won’t reveal.
Common pitfalls and cognitive traps
One common error is confusing “feeling” with probability. Watching a match and becoming convinced it’s going to be a goalfest doesn’t change the pre-match information unless the live stats substantiate that feeling. Another trap is over-trading: jumping on every small market move without recalculating true EV will bleed a bankroll over time.
Also watch for schedule and referee impacts. Late substitutions, red cards, or fixture congestion can materially shift goal expectancy. Factor those into your model or choose not to bet when uncertainty increases rapidly and you can’t update your estimate accurately.
Tools, data sources, and further learning
Use xG providers and match event data for better forecasting. Public APIs and platforms let you test small models without huge investment. I started by building a simple Poisson/xG spreadsheet and then migrated to scripts that pulled data automatically. That progression made it easier to spot where Asian lines offered meaningful edges.
Also read widely: betting exchanges and bookmaker resources explain market mechanics, while analytics outlets explain scoring models and shot-based metrics. Combine market understanding with statistical modeling to develop repeatable, disciplined strategies rather than relying on gut calls.
Further reading and authoritative sources
- Pinnacle’s betting guides explain Asian handicaps and totals in clear market terms and are useful for understanding bookmaker handling of quarter lines: https://www.pinnacle.com/en/betting-resources
- StatsBomb’s analysis on expected goals and how shot-based metrics improve forecasts is a practical resource for building better models: https://statsbomb.com/
- Dixon and Coles’ modelling work remains foundational for football score modeling and is recommended for readers who want the statistical theory behind goal distributions: Maher, M. J. (1982) and related statistical literature on football scores (JSTOR)
- FiveThirtyEight’s soccer predictions and methodology illustrate applied models at scale and how forecasting is used in public-facing projections: https://fivethirtyeight.com/tag/soccer-predictions/
The Asian total lines offer refined control over risk and reward when you approach them with a clear model, disciplined staking, and an eye for live-game signals. Start small, keep records, and let the math rather than the moment guide your sizing and decisions.

