Throw-ins feel like a small, boring part of a match until you realize they add up. Bookmakers price totals for corners, cards, and goals endlessly, but throw-ins are a quieter market with exploitable patterns if you approach them methodically. This article walks through why throw-ins matter, what shapes their totals, and practical, data-driven ways to find value.
Why throw-ins are worth attention
Throw-ins are less volatile than goals and often reflect broader game rhythms: possession, flank play, and pressure. Because they’re frequent and relatively independent events, totals markets can be more predictable than markets driven by rare outcomes like goals or red cards.
Bookmakers pay less attention to niche totals than to high-profile markets, which opens opportunities for bettors who study context. With careful research, you can turn small edges in expected throw-ins into steady returns over time.
What drives the total number of throw-ins
Several interacting factors determine how many throw-ins a match will produce. A useful approach is to break the game down into supply (how often the ball leaves play along the sidelines) and demand (how opponents force those situations).
Understanding these elements helps you form a view before kickoff and adjust during the match if you’re live-betting.
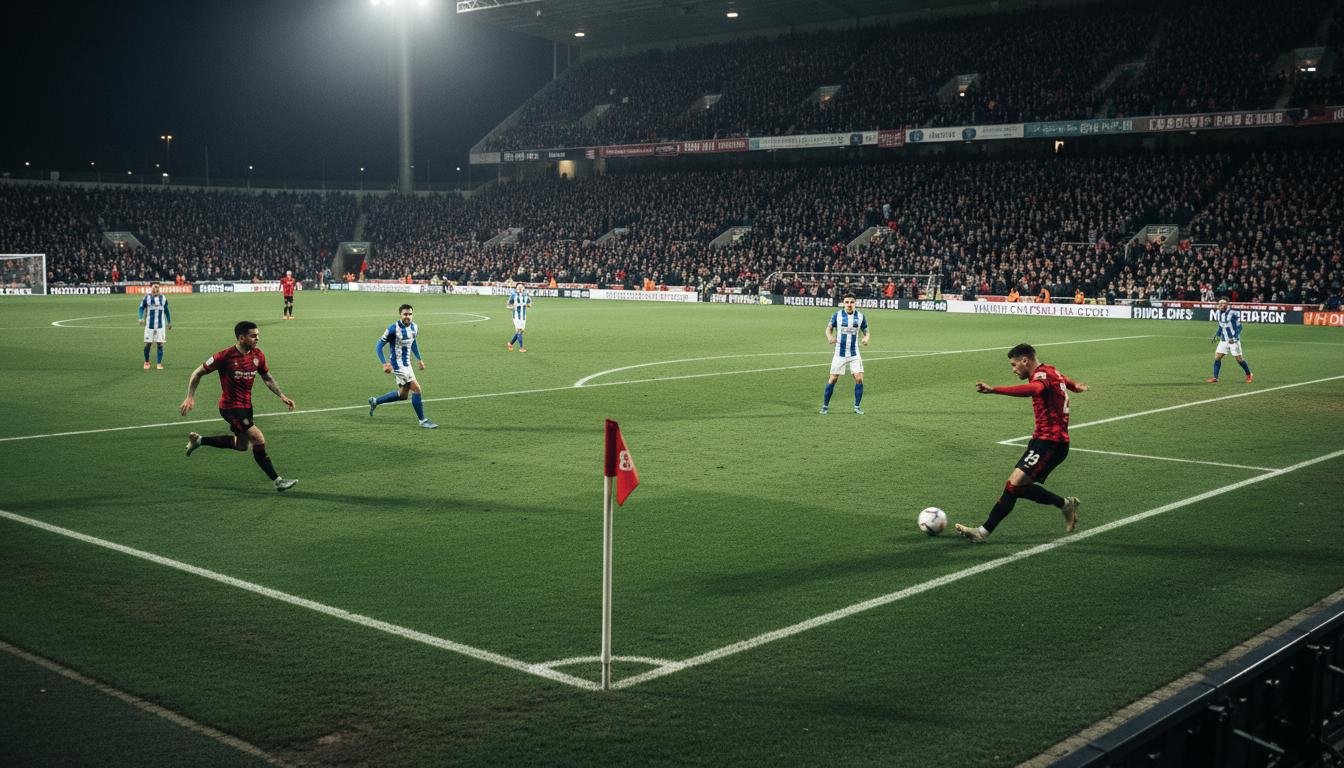
Team tactics and touchline play
Teams that use width, rely on overlapping fullbacks, or play frequent long throws will naturally generate more throw-ins. Conversely, teams that favor central possession, short passing, and buildup through midfield often keep the ball away from the sidelines.
Study heat maps and full-back involvement on sites like FBref and WhoScored to see which teams habitually tug play toward touchlines. Those visual cues reveal tendencies not obvious in goal-based stats.
Opponent style and pressing intensity
A high-pressing opponent can force hurried clearances that end up as throw-ins; low-block teams invite possession but not necessarily more sideline exits. Matchups matter: two teams that battle along the flanks produce more throw-ins than a clash of compact, central attackers.
Look at head-to-head patterns. Some teams routinely concede throw-ins to particular opponents because their pressing or physicality forces mistakes near the touchline.
Referees, stoppages, and added time
Referees influence game flow more than most bettors expect. Officials who let play run will create fewer stoppages and potentially fewer throw-ins called for minor touchline disputes. Conversely, matches with frequent stoppages or injury delays can skew totals.
Referee history is an underused data point; examine their past matches to see whether they tend to allow quick restarts or micromanage play. That behavior can shift the expected total by several throw-ins across 90 minutes.
Pitch size, condition, and weather
Smaller pitches produce more contested sideline situations and put defenders under pressure near the touchline, increasing throw-ins. Poor pitch conditions or strong winds also tend to send the ball out more often than in ideal conditions.
Always check stadium specifications and weather forecasts when placing pre-match bets. Those physical factors are simple to include but commonly overlooked by casual punters.
Data-driven modeling: how to build an edge
Start with historical averages: compute each team’s mean throw-ins per 90 minutes across an appropriate sample, such as the last 12 months or 30 games. Combine team A’s offensive tendency with team B’s defensive tendency to create a match expectation.
Account for home/away splits and recent form; short-term dips or surges in a team’s flank usage can matter. Use at least 20–30 matches per team for reasonable stability, and expand the window if possible for rare competitions.
Simple expected value example
Here’s a pared-down example to illustrate how an edge can emerge. Suppose Team X averages 16 throw-ins per game, Team Y concedes 18 on average, and the bookmaker posts an over/under line at 30. You’d combine tendencies to estimate a match expectation and then compare that to the market line.
Don’t mistake a single favorable line for a guaranteed win. Treat these outcomes probabilistically and calculate expected value (EV) before staking.
| Metric | Value |
|---|---|
| Team X average | 16 |
| Team Y conceded average | 18 |
| Estimated match total | 34 |
| Bookmaker line | 30 |
In this hypothetical the model suggests the market is underestimating total throw-ins. If the odds on the over offer positive EV after correcting for bookmaker margin, that’s a candidate bet.
In-play strategies and timing
Live betting is where throw-ins become particularly interesting. Early phases of a match often have predictable patterns: if both teams start cautiously, the number of throw-ins per 15-minute block can be low, and lines will adjust accordingly.
Watch for mid-game tactical shifts—substitutions that push teams wider, a red card pushing a team onto the back foot, or sustained pressure that forces repeated clearances. Those situations create short windows of value that evaporate quickly as markets respond.
Minute-by-minute micro-bets
Micro-bets on totals for the next 10 or 15 minutes can offer excellent risk-reward if you can read momentum. For example, a series of throw-ins in quick succession often signals a pattern that will continue for a short period, and prices for immediate totals may lag behind reality.
Be disciplined: live margins are often higher, and latency between your read and the market can cost you. Use small stakes and quick, clear exit rules when playing in-play.
Staking plan and risk management
Bankroll management is non-negotiable. Because throw-ins are frequent and edges are usually small, use flat or fractional staking rather than martingale-style bets. A sensible rule is to risk 1–2% of your bankroll on any single wager.
Track your bets meticulously. Record the model input, odds taken, stake, and outcome. Over time, pattern analysis will reveal which leagues, referees, and team profiles actually deliver the forecasted edge.
Common pitfalls and practical tips
A big mistake is overfitting to small samples: a few high-throw-in games don’t make a trend. Conversely, ignoring matchup nuance and blindly following league averages erodes value because teams aren’t interchangeable.
Use multiple sources of data. Event providers like Opta and StatsBomb give reliable touchline event logs, while FBref and WhoScored provide accessible summaries and heat maps. Combine objective data with live observation to form a rounded view.
In my own betting, I found value in second-division leagues where bookmaking resources are thinner. Small, consistent edges there produced a better return than chasing glamour matches where markets are razor-tight.
Sources and experts
- StatsBomb (tactical and event data): https://statsbomb.com/
- Opta / Stats Perform (data provider widely used by analysts): https://www.statsperform.com/
- FBref (match statistics and player/team profiles): https://fbref.com/
- WhoScored (heat maps and tactical breakdowns): https://www.whoscored.com/
- Betfair (exchange markets and trading guides): https://www.betfair.com/

